User guide
Dashboard
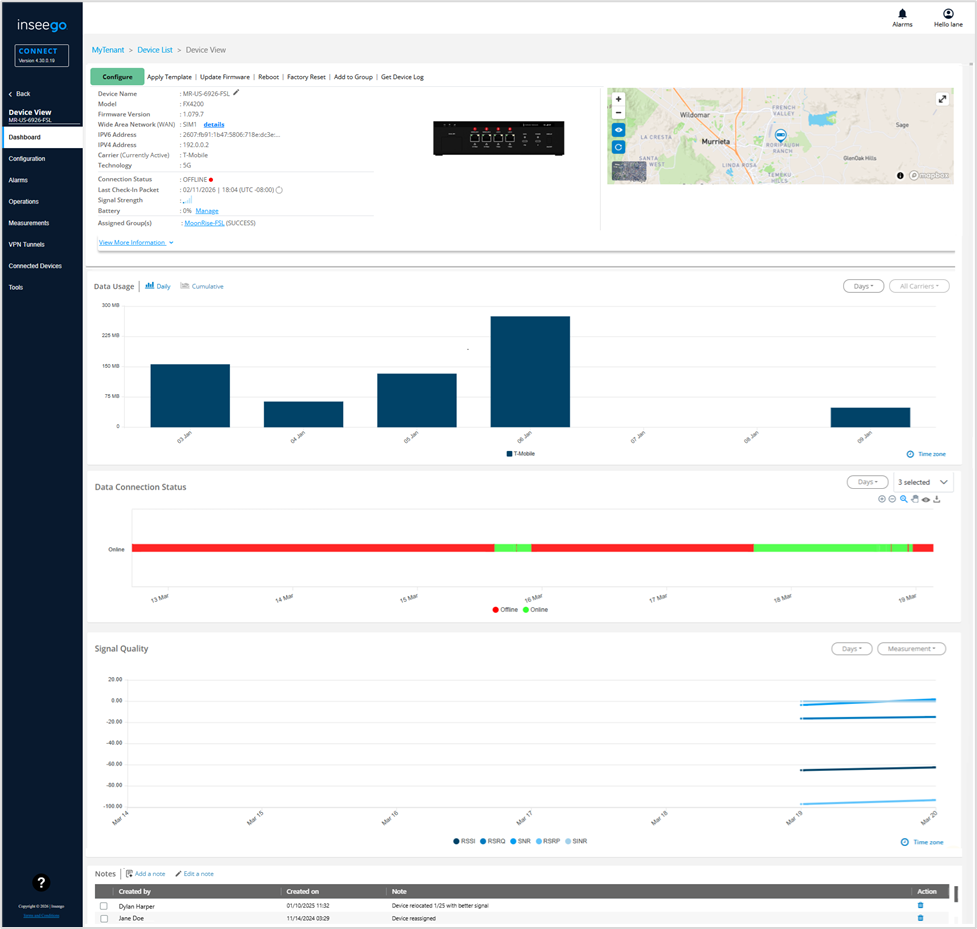
When you click on a device name on the Dashboard Home, Dashboard Map, Device List, or Operations page, a dashboard with details for only that device appears.
The Device View Dashboard page displays details, a map, data usage, data connection status, and signal quality information for the device.
NOTE: Click Back at the top of the left navigation pane to return to your previous page.
Information
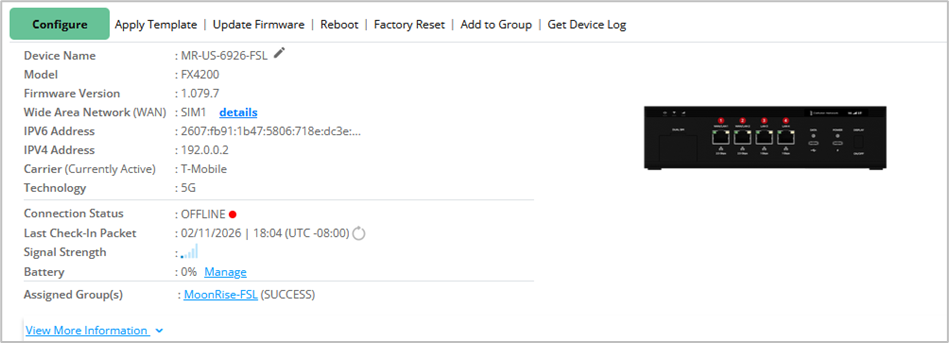
The upper left section of this page provides similar information to what is displayed on the Device List page.
TIPS
 Use the pencil icon next to Device Name to edit the name.
- Click on Details link next to Wide Area Network (WAN) to view SIM auto-selection details*.
 Click the refresh icon next to Last Check-in Packet to request a fresh packet of data from the device without waiting for the next scheduled transmission.
- Click on the Manage link next to Battery to configure battery modes*.
- Click on a group name next to Assigned Group(s) to go to the dashboard for that group.
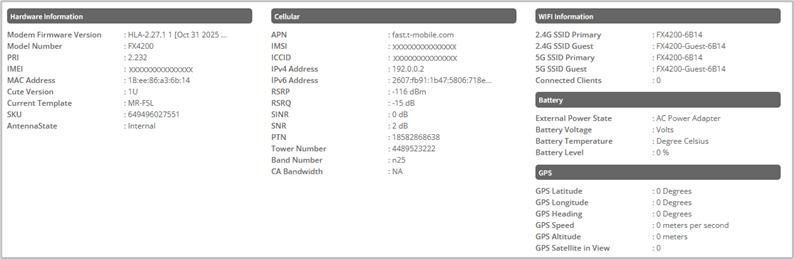
- Click the View More Information link at the bottom of this section for more device details:
You can make changes to the device using the commands along the top:
Configure: Allows you to view and change settings on the device. Use the side menu in the dialog to navigate. When you make a change, a change icon appears on the side menu and next to each changed item. A red warning appears if you need to fix something. Make all your changes and select Save to Device.
Apply Template: Allows you to apply a template created in Devices > Templates to the device.
Update Firmware: Instructs the device to check for a pending firmware update. If there is a new firmware version, it is downloaded and applied.
Reboot: Restarts the device. The rebooted device will automatically reconnect to Inseego Connect once it resumes operation.
Factory Reset: Resets all settings on the device to factory default values.
CAUTION: If you use Factory Reset, you will need to reconfigure the device to work in your environment.
Add to Group: Allows you to the device to an existing group, or you can create a new group.
Get Device Log: The cloud requests a log from the device and the device uploads the log to the cloud. When a log is available displays below the information in this section. The link remains until there is a new request for a log.
NOTE: Logs are encrypted and not readable. They are intended for Support use only.
Map
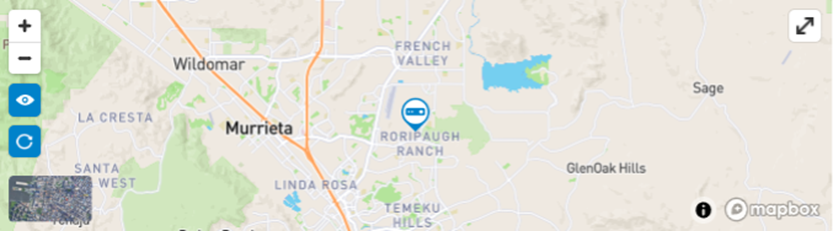
The map shows the location of this device.
TIPS
 Use the expand icon in the upper right to expand the map size for easier viewing.
 Use the plus and minus icons in the upper left of the map to zoom in and out. You can also zoom in and out using the mouse wheel. You can navigate the map by clicking with the left mouse button and dragging the map.
 Use the eye icon to reset zoom.
 Click the refresh icon to update the map with the latest information sent by the device.
 Click the image in the bottom left to toggle between satellite and street view.
Data Usage
The Data Usage graph provides data usage (in MB or GB) for this device.
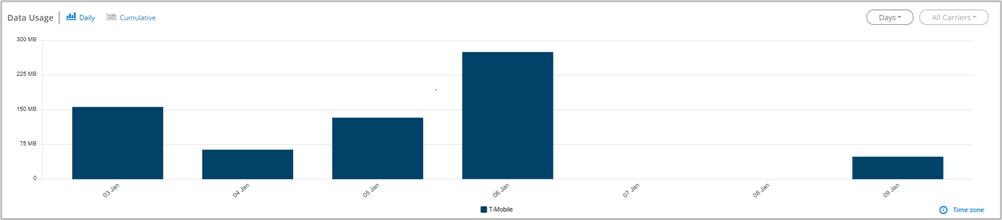
You can select from the following display options on the upper left:
- Daily — Displays data usage for this device per day.
- Cumulative — Displays 30 days of cumulative and projected data usage for this device. The projected data usage is forecast based on usage patterns from the last 30 days.
You can select from the following display options on the upper right:
- Days — Use the dropdown to display usage for 7 or 30 days (when Daily is selected).
- Billing Start Date — Use the dropdown to select a billing start date to store for each carrier (when Cumulative is selected).
- All Carriers — Use the dropdown to display usage for a specific service provider or all providers.
TIP
- Hover over a color in the graph for details.
- Hover over Time zone in the bottom right to see the time zone for which data usage values are calculated. You can change the time zone on the Settings page.
Data Connection Status
The Data Connection Status graph provides a timeline of when the device has been online (connecting with Inseego Connect) and offline (not connecting with Inseego Connect).
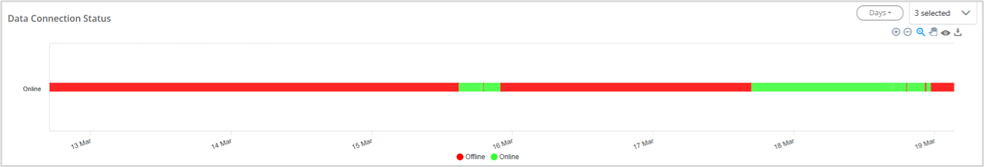
TIPS
- Hover over a color segment in the graph for details.
- Use the Days dropdown to display usage for 7 or 30 days.
- Use the 3 selected dropdown to filter by the type of operation.
Signal Quality
The graph provides signal quality information for this device (in dBm) by day.
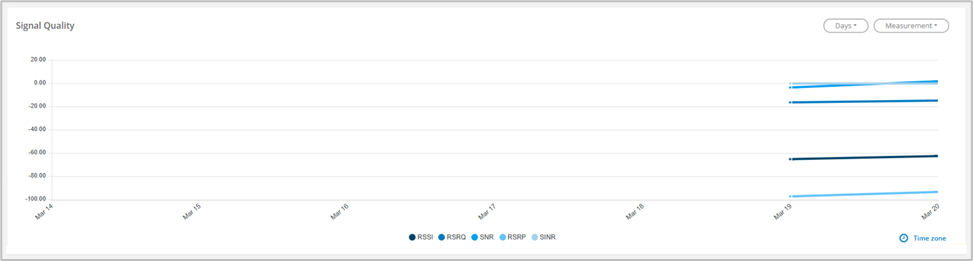
RSSI: Received Signal Strength Indicator. The estimated measure of how well the device can hear a signal from a radio transmitter.
RSRQ: Reference Signal Received Quality. A calculated value from RSRP and RSSI that provides a measure of signal and interference.
SNR: Signal to Noise Ratio. The ratio of signal power to noise power expressed in decibels. SNR is a positive value, and higher numbers are better.
RSRP: Reference Signal Receive Power. The measure of signal strength, similar to RSSI, but RSRP measures lower than RSSI due to the method of calculation.
SINR: Signal to Interference plus Noise Ratio. The measure of signal quality, taking interference and noise into account. SINR values are positive, and higher numbers are better.
TIPS
- Hover over a line on the graph for details.
- Use the dropdowns in the upper right to change the number of days displayed or to filter on a specific measurement.
- Hover over Time zone in the bottom right to see the time zone used to calculate values.
Notes
The Notes section allows you to create, edit, and track notes on the device. The most recent note displays on the Device List page. Users with Admin or Manager roles can add or edit notes.

TIPS
 Use Add a note to add a note.
 Use Edit a note to edit a selected note.
 Use the trash icon to delete a note.
| *Available for select devices. |


